
// Interactive tool
Orchestration Capacity Audit
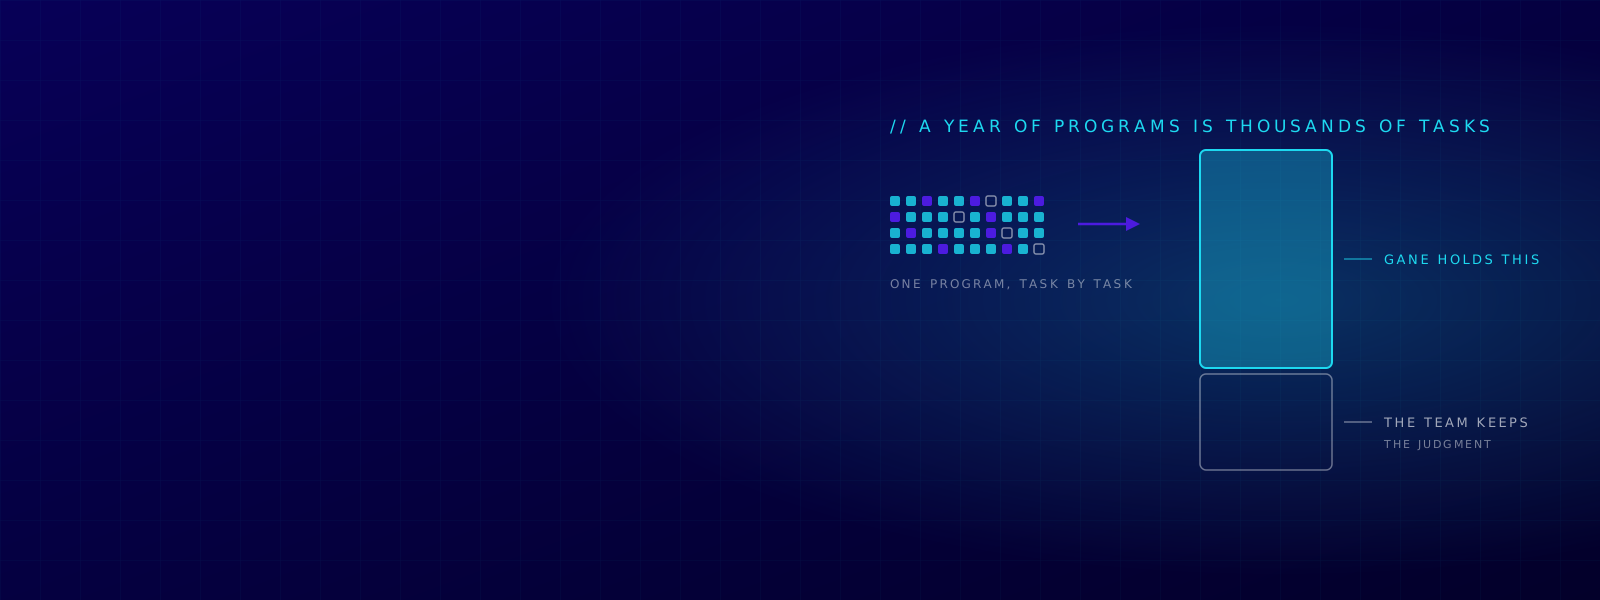
Many marketing programs hide dozens of small tasks, and across a year the work runs into the thousands. This audit counts that work, shows what Gane can carry, what still needs a person, and what that means for the team you have.
Start from an example plan, or start from scratch
Start with the annual program mix and the people available to run it. If you want to see a completed audit first, load one of the example plans below.
These are the same three plans used in the Revenue Cascade Calculator. The Revenue Cascade tests whether the revenue plan has enough audience and team capacity. The Capacity Audit takes the same program mix and workload hours, then breaks that workload into the tasks underneath it. Together, those tasks form the task graph used to show what Gane can carry and what remains with people. Because both tools use the same task graph, the annual workload hours reconcile.
Lean team, the foundational program
A $3m new-logo number on a small audience, and the foundational program every B2B team now runs: a monthly webinar series, a benchmark, a pair of online summits, quarterly guides and the always-on engine. One marketer to run all of it.
- Goal
- $3m
- Programs
- 98 a year
- Team
- 1 FTE
- Hours
- 90 a month
Growth-led, events layered on
A $12m number leaning on expansion, with an audience built up over years and a team that never grew with it. Hosted events, roadshows and executive dinners sit on top of the foundational program, and just two and a half people are expected to carry it.
- Goal
- $12m
- Programs
- 142 a year
- Team
- 2.5 FTE
- Hours
- 90 a month
Funded team, the whole portfolio
A $10m number and a funded team running everything at once: multiple webinar series, a flagship virtual conference, the field calendar and every always-on motion, while the reachable audience has not caught up with the revenue target.
- Goal
- $10m
- Programs
- 176 a year
- Team
- 6 FTE
- Hours
- 90 a month
Start with how many of each you actually ship in a year, not how many are on the plan. Count the blog posts. Teams often under-count repeated work and over-focus on flagship programs. In the standard graph, thirty-six blog and SEO articles at 15 hours each add up to 540 hours, compared with 80 hours for one benchmark report.
The mix starts with common program types. Add anything else you run from the library below, from paid media and events to always-on monthly work, and remove anything you do not run. Hours per program come from the same standard task graph used by the Revenue Cascade Calculator, so the annual workload hours reconcile.
These hours cover marketing production and promotion: the work of getting programs built and into market. They do not include the wider organisation's time, so an event includes the booth build and promotion but not the sales and leadership hours spent working it. The headcount in step 3 should therefore include the people doing this production and promotion work, not the wider marketing organisation.
| Program type | Programs per year | Task definitions | Hours per program | Hours per year | Team keeps with Gane | Gane holds | |
|---|---|---|---|---|---|---|---|
| Time-based programs | |||||||
| Monthly Webinar Series | 0 | 0.0 | 0 | 0 | 0 | ||
| Virtual conference | 0 | 0.0 | 0 | 0 | 0 | ||
| Hosted user conference | 0 | 0.0 | 0 | 0 | 0 | ||
| Tradeshow or field event | 0 | 0.0 | 0 | 0 | 0 | ||
| eBook or guide | 0 | 0.0 | 0 | 0 | 0 | ||
| Whitepaper or technical brief | 0 | 0.0 | 0 | 0 | 0 | ||
| Benchmark report | 0 | 0.0 | 0 | 0 | 0 | ||
| Always-on programs · per month | |||||||
| Free trial or demo program | 0 | 0.0 | 0 | 0 | 0 | ||
| Answer-engine visibility | 0 | 0.0 | 0 | 0 | 0 | ||
| SEO technical and content maintenance | 0 | 0.0 | 0 | 0 | 0 | ||
| Organic social and advocacy | 0 | 0.0 | 0 | 0 | 0 | ||
| Monthly newsletter | 0 | 0.0 | 0 | 0 | 0 | ||
| Total | 0.0 | 0 | 0 | 0 | 0 | ||
Every task is assigned one of three ways of working: Gane carries it end to end, Gane does the work and someone on your team reviews it, or it stays with your team. The percentages below show how much of the task time still stays with your team in each case.
The percentages assigned to the team are deliberately not zero. Even when Gane carries the work end to end, a team member still sets the goal, context and guardrails, checks the result, and remains accountable for the outcome. The 10% assumption reflects that contribution, and you can change it if it does not match how your team works.
| Disposition | Team keeps today | Team keeps with Gane | What it means |
|---|---|---|---|
| System | 100% | Gane handles the execution end to end. A person sets the intent and checks the result. | |
| System with approval | 100% | Gane produces it, a person reviews and approves. | |
| Person | 100% | Stays with people. Judgment, relationships, and the live room. |
Use the headcount that actually produces and promotes the work, not total marketing headcount. Productive hours per person per month should reflect meetings, holidays and unplanned work. For most teams that means materially less than 160 hours a month; use a realistic productive-hours figure or the audit will overstate the capacity you actually have.
The dollar value is calculated from the fully loaded hourly labor cost entered here. Example plans use illustrative US labor rates, so replace the rate with your own. Keep the FTE figure in view too: it lets you translate the result into your own local salary market.
Every program is a stack of small tasks across the phases of getting it built and into market. This is how many tasks each type carries and where their hours land, summed by phase. Open a type to see the shape of its work, and which phases Gane gives back the most.
Does the load fit, and who carries it
The audit answers two questions: does this annual workload fit the team you have, and how much of the work could Gane carry? Everything else on the page explains those two answers.
Waiting on the mix and the team above.
Waiting on the mix and the team above.
Where the work goes
| Disposition | Hours per year | Team keeps | Reclaimed | Share of the load |
|---|---|---|---|---|
| Total | 0 | 0 | 0 | 0.0% |
What is left for the team, by phase
| Phase | Hours today | Hours with Gane | Reclaimed | Share reclaimed |
|---|---|---|---|---|
| Total | 0 | 0 | 0 | 0.0% |
Read the phase table to see where Gane can take on the most work. Plan and Content keep more human judgment, so a larger share of those hours stays with the team. Build, Distribution, Run, Measure and Ongoing contain more repeatable execution, such as producing, configuring, publishing, moving work across systems, monitoring performance and keeping programs moving. That is why Gane can carry a larger share of the hours in those phases.
The audit, as plain text
This assembles as you type. Copy it into a planning doc or a board deck. It includes the two findings, where the work goes, and any changes you made to the team-keep assumptions, so the assumptions behind the result stay visible.
ORCHESTRATION CAPACITY AUDIT
0 programs a year across 0 active program types
0 task definitions in the standard graph
Modelled with work allocated between Gane and the team.

THE LOAD
  Hours the work takes without Gane:        0
  Hours the team keeps with Gane:           0
  Hours reclaimed:                          0
  Share of the work reclaimed:              0.0%

AGAINST THE TEAM YOU HAVE
  Hours available:                          0 (0.0 FTE)
  Share of capacity it takes today:         0.0%
  Share of capacity with Gane:              0.0%

WHAT COMES BACK
  Reclaimed hours as full-time people:      0.0
  Reclaimed hours at loaded labor cost:     $0
  Reclaimed hours per week across the team: 0.0

THE VERDICT
  Nothing to judge yet. Set the mix and the team, and the verdict lands
  here.

WHERE THE WORK GOES

WHAT IS LEFT FOR THE TEAM, BY PHASE

THE MIX

WHAT STAYS WITH PEOPLE
  Judgment, relationships, the live room, and the final call on what to
  do differently next time. Gane can surface what happened and recommend
  what should change; people retain the judgment and accountability.
  Those hours stay with people by design, which is why the tasks marked
  Person give nothing back.
What stays with people: judgment, relationships, the live room, and the final call on what to do differently next time. Gane can surface what happened and recommend what should change; people retain the judgment and accountability. Those hours stay with people by design, which is why tasks marked Person show no reclaimed hours.
Nothing here leaves your browser on its own. The audit saves to this device so you can come back to it, and the clear button removes it. There is no gate and no email needed to use any of it. The one exception is the send button above, which is a deliberate act: it submits the derived figures with your details. The task graph and your overrides stay on this device.
// Questions
About the Orchestration Capacity Audit
- What is the Orchestration Capacity Audit?
- It is a free planning tool that breaks a year of marketing programs into the tasks they really contain, then shows how much of that work an operating system can carry and how much stays with people. It turns a program mix into an honest hours and capacity picture for the team you actually have.
- How does it estimate the workload?
- It works from a standard task graph of 2,037 task definitions across 56 program types, from webinars and events to paid media, SEO and the always-on monthly work. Each task carries the minutes it takes and how many times it runs per program, so one program’s hours are the sum of its tasks, and a year’s hours are that multiplied by the number of programs you run. The total is measured against your team’s available productive hours. It counts marketing production and promotion hours, not the wider organisation’s time.
- What do "with Gane" and "without Gane" mean?
- Without Gane, the team carries every hour the work takes today. With Gane, each task is given a disposition: the system holds it end to end, the system produces it and a person approves, or it stays with people. Tasks the system holds still keep a small share of their hours, because someone sets the intent and reads the result. The gap between the two is the capacity Gane releases.
- Is it free, and is my data sent anywhere?
- Yes, it is free and ungated. The audit runs entirely in your browser and saves to your device so you can come back to it. Nothing is sent to Gane unless you choose to send it.
- How is it different from the Revenue Cascade Calculator?
- The Revenue Cascade Calculator builds and tests a plan from a revenue number: the pipeline, responses, reachable audience, programs, and team it requires. The Orchestration Capacity Audit takes that program mix and breaks it into the work, then allocates the work between the system and people. Plan the number first, then audit who carries it. The two tools share one task graph, so their hours reconcile.
- Can I use my own numbers?
- Yes. Set your program mix, your team size and productive hours, and your fully loaded hourly cost, then open any program type and retime, re-disposition, or override individual tasks. Every change updates the capacity and the reclaimed hours live.
Let the system carry the work. Keep the judgment with the team.
Gane takes on the repeatable work across the operating loop: coordinating, producing, distributing, monitoring, and keeping programs moving, while people stay in control of the decisions that need them. The reclaimed hours in this audit are the result.