
// Interactive tool
Revenue Cascade Calculator
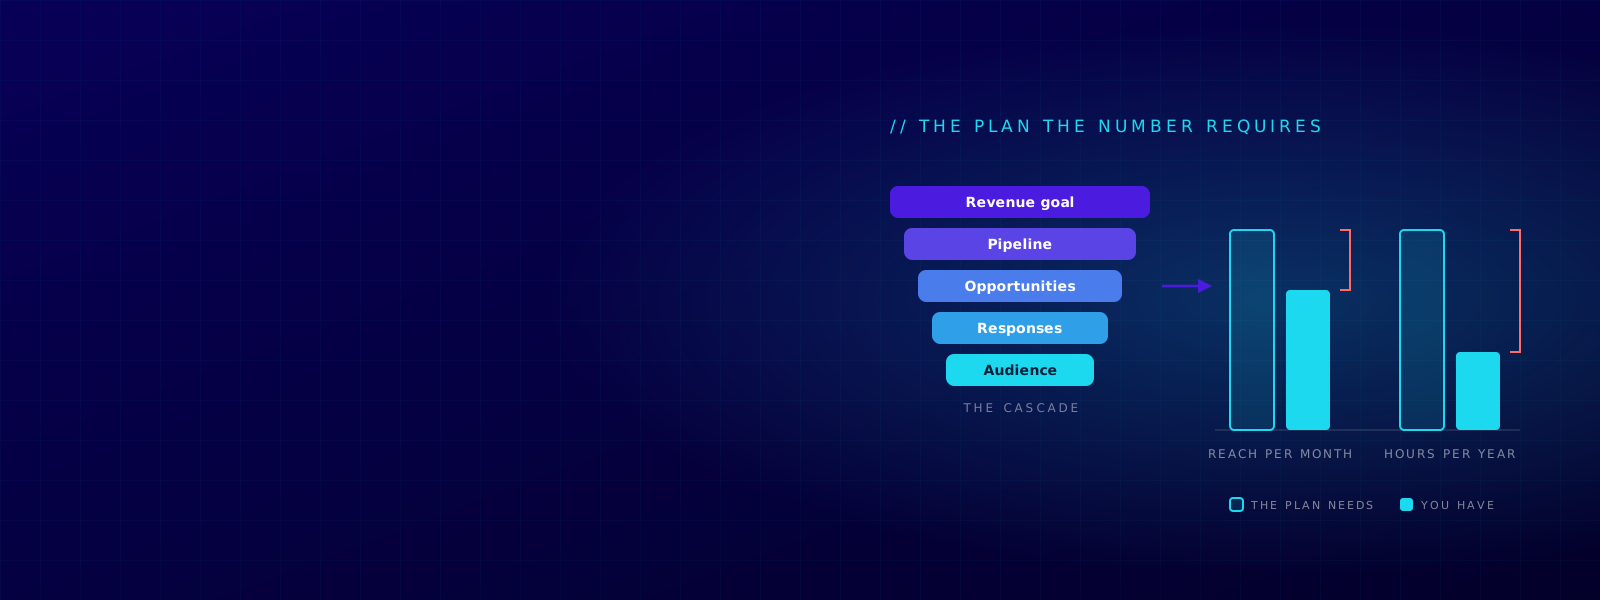
Start with the number. The plan follows. From your revenue target and operating assumptions, the Revenue Cascade derives the pipeline, responses, audience, programs, and the capacity to hit it.
Start from an example plan, or start from scratch
Building a plan with your own numbers takes about 30 minutes and usually benefits from input from your sales team. If you want to see what the finished output looks like first, load one of the example plans below. Each one fills in every assumption, so you can see the audience, workload and team capacity the revenue target requires. Pick the closest fit, then clear it when you are ready to enter your own numbers.
The same three example plans are available in the Orchestration Capacity Audit. The Revenue Cascade shows what the revenue target requires; the Capacity Audit takes the same program mix and workload hours and opens up the tasks underneath them. Both tools use the same task graph, so the workload hours reconcile.
Lean team, the foundational program
A $3m new-logo number on a small audience, and the foundational program every B2B team now runs: a monthly webinar series, a benchmark, a pair of online summits, quarterly guides and the always-on engine. One marketer to run all of it.
- Goal
- $3m
- Mix
- 85% new logo
- Team
- 1 FTE
- Reach
- 12,000
Growth-led, events layered on
A $12m number leaning on expansion, with an audience built up over years and a team that never grew with it. Hosted events, roadshows and executive dinners sit on top of the foundational program, and just two and a half people are expected to carry it.
- Goal
- $12m
- Mix
- 75% growth
- Team
- 2.5 FTE
- Reach
- 150,000
Funded team, the whole portfolio
A $10m number and a funded team running everything at once: multiple webinar series, a flagship virtual conference, the field calendar and every always-on motion, while the reachable audience has not caught up with the revenue target.
- Goal
- $10m
- Mix
- 80% new logo
- Team
- 6 FTE
- Reach
- 25,000
Everything below derives from this one figure. Use the new revenue the business has committed to, not the stretch number and not the number after churn and renewals are added back. If marketing is measured on a different figure than the board sees, model the one you are measured on and note the difference somewhere your CFO will read it.
This planner runs on a standard twelve-month year, so the cascade and the seasonality below stay in step. Real cycles are not always a calendar year: a half-year push, an eighteen-month build. In Gane you set the cycle, and the plan and the work both run on the length you choose.
Split the goal between new logo and growth from existing customers. This is the first place plans quietly overstate what marketing has to produce, because expansion revenue that customer success will deliver often sits inside the number marketing is handed. Take the split from finance, not from the pipeline report.
| Type | Share of bookings | Bookings |
|---|---|---|
| New logo | $0 | |
| Growth | $0 | |
| Total | 0% | $0 |
Within new logo and within growth, split the bookings by where the pipeline comes from. Each column totals 100% on its own, because these are two separate splits rather than one. Most teams find growth bookings lean far more on sales and on customer success than new logo does, and modelling both at the same marketing share is what produces a demand plan nobody can staff.
Only marketing-sourced bookings flow into the response and reach math below. Sales-sourced and other-sourced bookings are carried here so the mix adds up, and then they stop. If you let them flow through, the audience requirement is overstated and the whole plan is wrong.
| Source | New logo share | Growth share | Bookings |
|---|---|---|---|
| Sales sourced | $0 | ||
| Marketing sourced | $0 | ||
| Other (partner, PLG) | $0 | ||
| Total | 0% | 0% | $0 |
Split the marketing-sourced number across your segments, then give each one its deal size and its three conversion rates. These should come from sales and from CRM history, not from marketing alone. A rate you cannot point at a report for is a wish, and every layer below this step multiplies it.
Record where each assumption came from in the source field. It carries into the exported plan, so next year starts from evidence rather than from this year's guesses.
| Segment | Share of mktg-sourced | Avg deal size | Win rate accepted to won | Acceptance rate created to accepted | Response to opp created | Responses required | |
|---|---|---|---|---|---|---|---|
| 0 | |||||||
| 0 | |||||||
| 0 | |||||||
| Total | 0% | 0 | |||||
Source for each assumption
Reachable audience: people you can realistically put a program in front of in a month across your owned and accessible channels, such as email, social, community, and partners. Not your total CRM or database size.
Count the people you can actually put a program in front of in a month, across everything you own or can get to: the audience that hears from you directly, your social following, your community, your partners. Not the total number of records you hold. The gap between those two numbers is usually large, and using the larger one is how a plan passes review in November and fails in March.
Monthly response rate is the share of that reachable audience who take a program action in a month, blended across those channels and taken from your own history rather than an industry benchmark. Growth in reachable audience is what you honestly expect to add over the year through acquisition, events, community and partners, net of decay.
Three fields is not how distribution actually works. Reachable audience here covers channels that behave nothing like each other, and a single blended response rate across all of them is the roughest assumption on this page. Performance varies by channel, by category, by offer and by how recently someone last heard from you.
So focus on the scale of the audience gap, not the exact number. It is good enough to tell you whether the plan is close or nowhere near, which is the decision this page exists to inform, and not good enough to plan a quarter against.
Two things it deliberately leaves out: what paid reach costs to buy, and how fast it stops working. Growth in reachable audience here is what you expect to build, not what you can rent. Inside Gane this is modelled against your own channel performance and audience labels rather than one averaged rate, which is the difference between an estimate and a forecast.
Weight the months to your own deal cycle. These twelve fields default to equal months, which is a placeholder and not a plan: almost no B2B business books an even twelfth of its year in August. Where you put the weight decides where the reach requirement peaks, and the peak month is the one that breaks.
| Jan | Feb | Mar | Apr | May | Jun | Jul | Aug | Sep | Oct | Nov | Dec |
|---|---|---|---|---|---|---|---|---|---|---|---|
Decide which program types carry the responses, and how many responses one program of each type brings in. Then translate that program mix into the work required to get it into market. Hours per program come prefilled from the task graph in the capacity audit, which counts everything: brief, research, draft, review, design, build, landing page, tracking, email copy, social, list pull, reporting, and the handoffs between them. Override any of them where your team is genuinely faster, but be careful going down. Lean teams estimate effort low, and that is the failure these numbers exist to catch.
Programs round up, because nobody runs 29.6 webinars. Wins and opportunities stay fractional, because rounding those up flatters the plan.
| Program type | Share of responses | Responses per program | Promotions per program | Tasks per program | Hours per program | Programs needed | Hours needed | |
|---|---|---|---|---|---|---|---|---|
| Time-based programs | ||||||||
| Webinar (one off) | 0 | 0 | ||||||
| eBook or guide | 0 | 0 | ||||||
| Benchmark report | 0 | 0 | ||||||
| Customer case study | 0 | 0 | ||||||
| Tradeshow or field event | 0 | 0 | ||||||
| Always-on programs · per month | ||||||||
| Blog and SEO article | 0 | 0 | ||||||
| Nurture email series | 0 | 0 | ||||||
| Total | 0% | 0 | 0 | |||||
Headcount available to produce and promote, not total marketing headcount. Exclude the people whose week goes to sales support, to the website, or to the leadership meeting. Productive hours per person per month is the honest figure after meetings, holiday, and the work that arrives unplanned. A full-time person rarely gives 160 hours a month to program work, and entering 160 anyway is how the plan below comes back green when it should be red.
The two gaps
A plan can work perfectly in a spreadsheet and still fail when it meets a real audience and a finite team. So the plan has to pass two tests: do you have enough reachable audience to generate the responses, and does the team have enough capacity to run the work? The rest of this page shows where each gap comes from.
Waiting on the goal, the conversion assumptions, and the reachable audience above.
Waiting on the program mix and the capacity above.
The ask, in full
What the operation has to carry
Tasks are counted from the same task graph the Orchestration Capacity Audit uses: every time a task runs, for every program in the mix. The audit reports the ‘task definitions’ behind that, which is a smaller number because one definition can run several times per program.
Check the promotion pace against the same reachable audience before you commit to it. If three promotions hit the same people in one week, that is a distribution collision, not a plan. An average response rate will not show you that.
The plan, translated into work
This assembles as you type. Copy it into a planning doc or a board deck. It does not just carry the target and assumptions; it shows the audience, work, capacity, and operating pace underneath them, because a plan should survive contact with the team that actually has to deliver it.
REVENUE CASCADE PLAN — 2027
Goal $0 over 12 months

THE ASK
  Marketing-sourced bookings:  $0
  Wins required:               0.0
  Accepted pipeline:           $0
  Accepted opportunities:      0.0
  Opportunities created:       0.0
  Program responses:           0

THE REACHABLE AUDIENCE
  Reachable audience required / month:    0
  Reachable audience available, month 1:  0
  Month 1 reachable audience surplus or (gap):0

THE WORK
  Programs:                    0
  Promotions:                  0
  Tasks:                       0
  Hours required:              0
  Hours available:             0
  Capacity the plan uses:      0%
  Capacity surplus or (gap):   0 hrs
  Headcount the plan needs:    0.0 FTE against 0.0 available

THE PACE
  Wins per month:              0.0
  Opportunities per week:      0.0
  Responses per week:          0
  Programs per month:          0.0
  Promotions per week:         0.0
  Tasks per week:              0.0
  Hours per person per week:   0.0

THE VERDICT
  Nothing to judge yet. Fill the steps above and the verdict lands here.

NEXT
  This plan requires 0 programs and 0 hours of program work across
  the year. Take it to the Orchestration Capacity Audit to break that workload
  into tasks and see what the team must carry and what the system can carry
  instead.

ASSUMPTIONS AND THEIR SOURCES
  Enterprise
    Average deal size       $0
    Response to opportunity 0%
    Created to accepted     0%
    Accepted to won         0%
    Responses required      0
    Source                  not recorded
  Mid-market
    Average deal size       $0
    Response to opportunity 0%
    Created to accepted     0%
    Accepted to won         0%
    Responses required      0
    Source                  not recorded
  SMB
    Average deal size       $0
    Response to opportunity 0%
    Created to accepted     0%
    Accepted to won         0%
    Responses required      0
    Source                  not recorded

SCOPE
  Only marketing-sourced bookings flow into the response and reach math.
  Sales-sourced and other-sourced bookings are carried so the mix adds up.

PROVISIONAL: THESE CHECKS DO NOT READ 100%
  Bookings mix by type reads 0%, not 100%
  Source mix, new logo reads 0%, not 100%
  Source mix, growth reads 0%, not 100%
  Segment share reads 0%, not 100%
  Program mix share reads 0%, not 100%
The numbers above are quietly wrong until these read 100%.The twelve-month cascade
The headline audience gap is the starting point. This table shows how it changes month by month. Reachable audience required is a monthly requirement, not a running total: the same contacts can be available again next month, so adding the twelve monthly requirements together would greatly overstate the audience you need.
| Layer | Jan | Feb | Mar | Apr | May | Jun | Jul | Aug | Sep | Oct | Nov | Dec | Annual |
|---|---|---|---|---|---|---|---|---|---|---|---|---|---|
| Marketing-sourced ($) | 0 | 0 | 0 | 0 | 0 | 0 | 0 | 0 | 0 | 0 | 0 | 0 | 0 |
| Wins required | 0.0 | 0.0 | 0.0 | 0.0 | 0.0 | 0.0 | 0.0 | 0.0 | 0.0 | 0.0 | 0.0 | 0.0 | 0.0 |
| Opportunities created | 0.0 | 0.0 | 0.0 | 0.0 | 0.0 | 0.0 | 0.0 | 0.0 | 0.0 | 0.0 | 0.0 | 0.0 | 0.0 |
| Program responses | 0 | 0 | 0 | 0 | 0 | 0 | 0 | 0 | 0 | 0 | 0 | 0 | 0 |
| Reachable audience required | 0 | 0 | 0 | 0 | 0 | 0 | 0 | 0 | 0 | 0 | 0 | 0 | — |
| Reachable audience available | 0 | 0 | 0 | 0 | 0 | 0 | 0 | 0 | 0 | 0 | 0 | 0 | — |
| Surplus or (gap) | 0 | 0 | 0 | 0 | 0 | 0 | 0 | 0 | 0 | 0 | 0 | 0 | — |
Nothing here leaves your browser on its own. The plan saves to this device so you can come back to it, and the clear button removes it. There is no gate and no email needed to use any of it. The one exception is the send button above, which is a deliberate act: it submits the derived figures with your details so we can pick the conversation up from your plan. Your working assumptions stay on this device either way.
// Questions
About the Revenue Cascade Calculator
- What is the Revenue Cascade Calculator?
- It is a free planning tool that starts from your revenue target and derives the plan underneath it: the pipeline, opportunities, program responses, reachable audience, program mix, and the team the number requires. It shows whether the plan fits the reachable audience and the team capacity you actually have.
- How does it work?
- You enter your revenue goal and your own funnel assumptions: bookings mix, pipeline source, segment deal sizes and conversion rates, reachable audience, seasonality, program mix, and team capacity. The page derives every layer live as you type. There is no calculate button, and it saves to your browser so you can leave and come back.
- What are the "two gaps" it reports?
- The audience gap and the capacity gap. The audience gap compares the reachable audience available in each month with the audience the response target requires; the headline figure uses month 1. The capacity gap asks whether the team has enough productive hours to run the program workload. A plan can pass one test and fail the other, and the constraint tells you what needs to change.
- Is it free, and is my data sent anywhere?
- Yes, it is free and ungated. Everything runs in your browser and saves to your device. Nothing is sent to Gane unless you choose to send it.
- How is it different from the Growth Calculator and the Orchestration Capacity Audit?
- The Growth Calculator is a fast two-input estimate. The Revenue Cascade Calculator is the full plan built on your own funnel, reachable audience, program, and team assumptions. The Orchestration Capacity Audit then breaks that plan into tasks and shows what an operating system can carry versus what stays with people. Quick estimate, then full plan, then capacity model.
- Can I start from an example plan?
- Yes. Three example growth plans load with every field filled in, so you can read a finished plan before entering your own numbers. Each lands in a different place: one short on both gaps, one with the reachable audience but not the hours, and one with the hours but not the audience.